
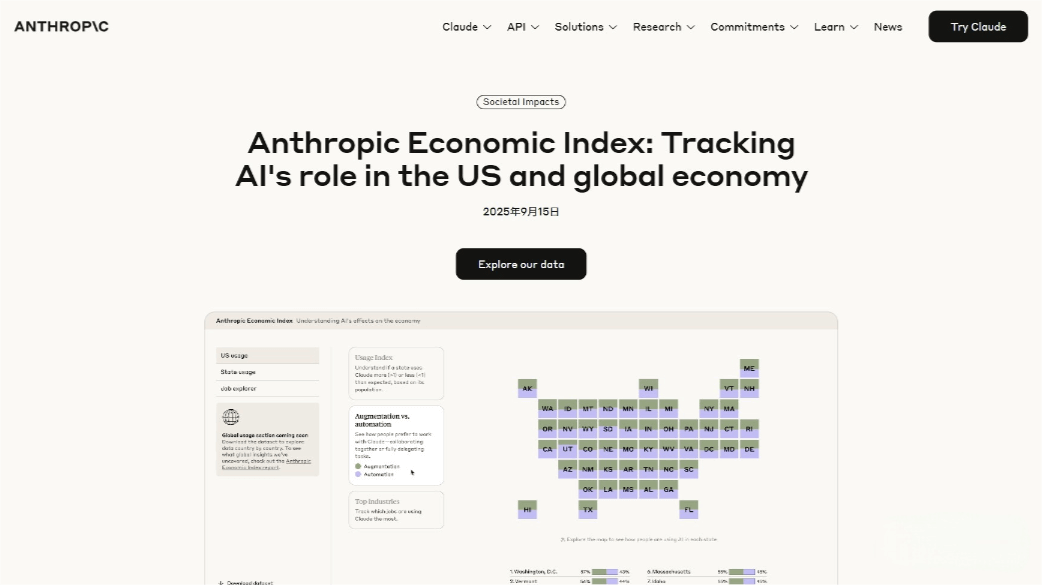
Anthropic’s Latest Report: “The Human Economic Index: Tracking AI’s Role in the U.S. and Global Economy”
This report primarily examines how AI (especially Claude) is being used across the globe and within individual U.S. states. Findings show that the U.S. leads by a large margin in Claude usage, followed by India, Brazil, Japan, and South Korea. At the national level, Claude usage is positively correlated with GDP per capita: high-income countries are more likely to use Claude for knowledge work rather than just programming. Within the U.S., AI usage varies depending on state-level economic structures—for example, in Washington, D.C., Claude is frequently used for document editing, while in California it is more often applied to programming. Over time, the proportion of automated tasks completed by Claude has risen from 27% to 39%, reflecting growing user trust in AI.
Travel planning in Hawaii, scientific research in Massachusetts, and web app development in India may seem unrelated at first glance. In reality, these represent some of the most widespread applications of Claude in their respective regions.
This does not mean these are Claude’s most popular uses—software engineering remains the dominant application across nearly every state and country. By “most widespread,” we mean that certain regions show unusually high demand for specific task types: for instance, users in Massachusetts are far more likely to seek scientific research assistance, while users in Brazil are six times more likely than the global average to use Claude for translation and language learning.
These findings come from our third Anthropic Economic Index report. In this edition, we track how AI is reshaping work and economic structures, with a focus on Claude’s applications across multiple dimensions:
-
State-level comparisons in the U.S.: For the first time, we provide a detailed assessment of interstate differences in AI adoption. The economic structure of each state strongly affects per-capita Claude usage, and the highest-usage states are not necessarily dominated by programming tasks.
-
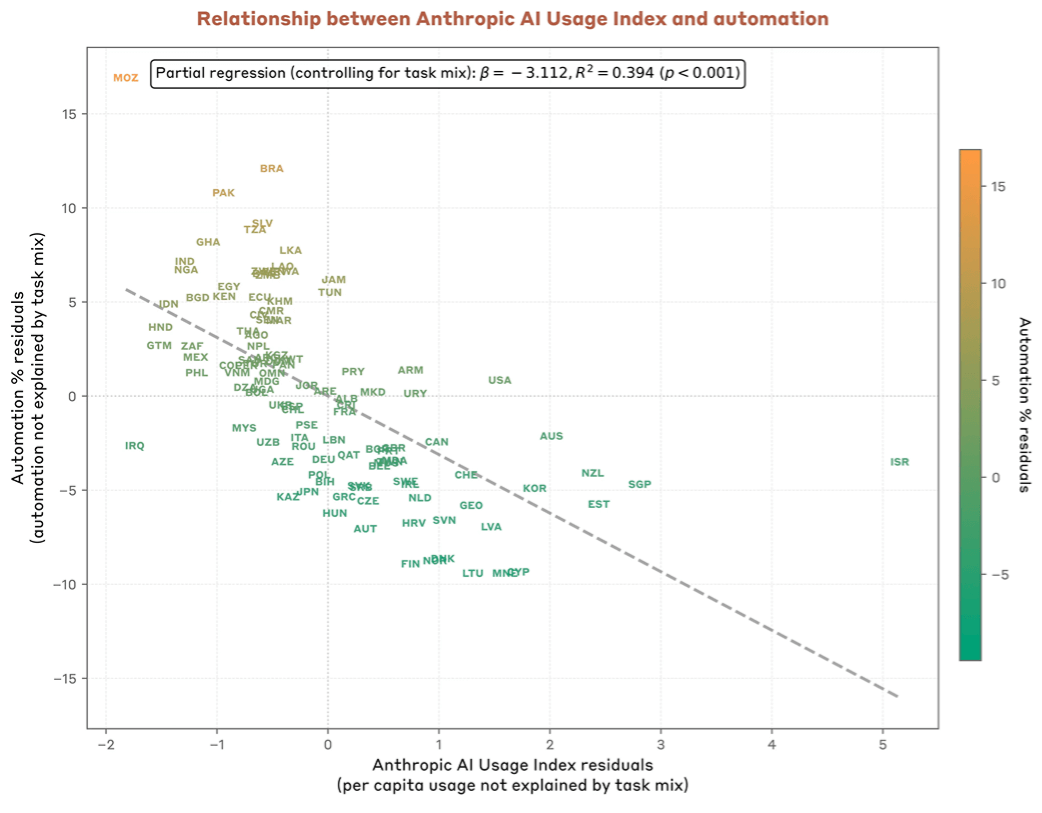
Cross-country comparisons: New analysis shows a strong correlation between national income levels and Claude usage intensity, with lower-income countries tending to rely more on AI for work automation.
-
Trends over time: Comparing Dec 2024–Jan 2025 data with Feb–Mar 2025 data, the share of “instruction-based automation” tasks rose sharply from 27% to 39%, suggesting that AI is taking on greater responsibility as user trust grows.
-
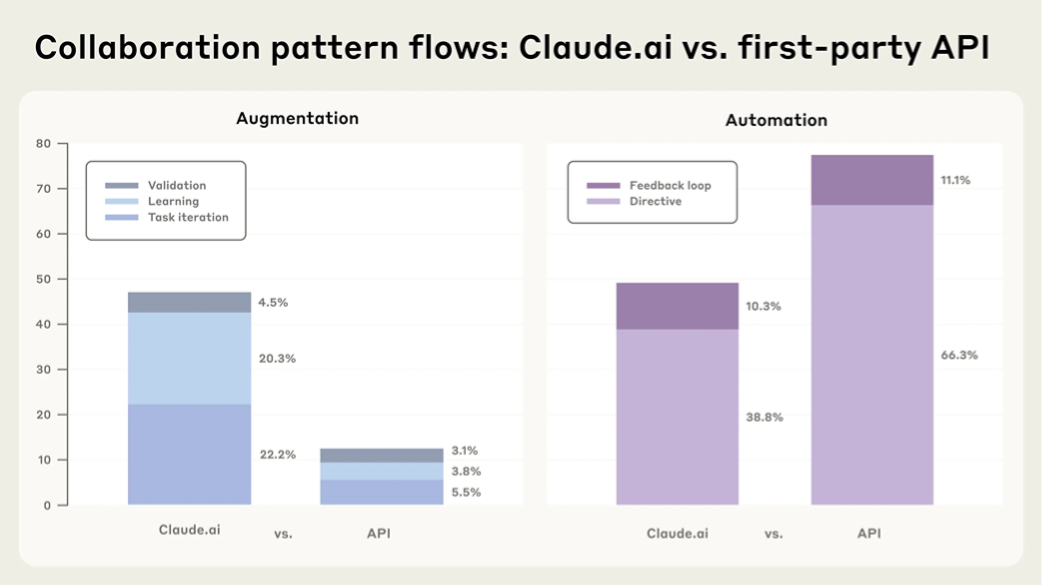
Enterprise usage: For the first time, we include anonymized data from Anthropic’s first-party API customers (beyond Claude.ai users). Results show that enterprise users display a much stronger preference for automated tasks compared to consumers—hinting at significant future impacts on labor markets.
We also launched an interactive website that allows users to explore Claude.ai usage trends across all U.S. states and occupations. To support further research, we have fully open-sourced the datasets from this and previous editions of the Economic Index.
Geographic Analysis
Cross-country patterns
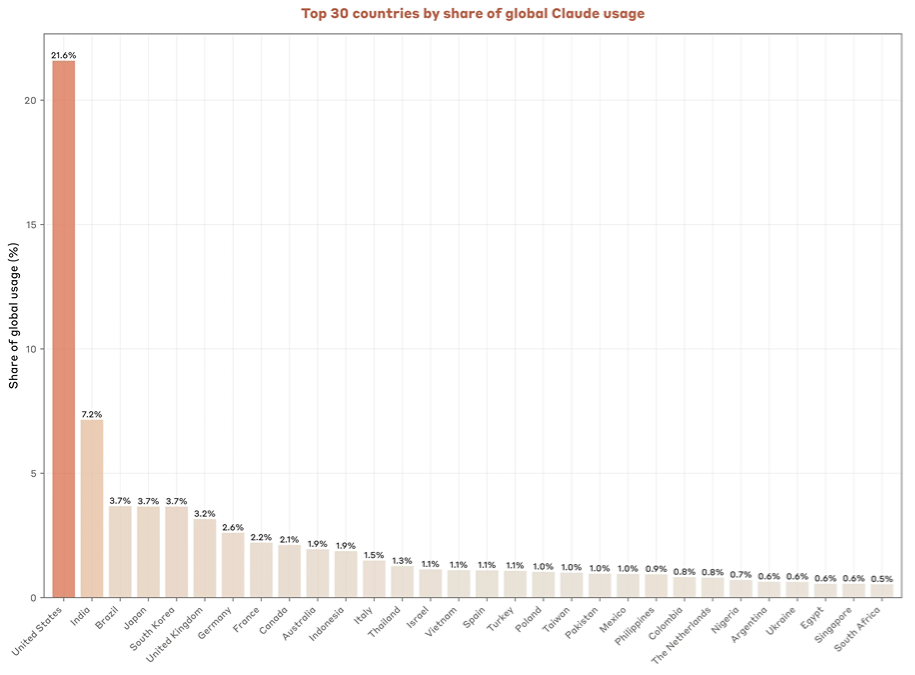
The U.S. leads in Claude usage, with India in second place, followed by Brazil, Japan, and South Korea.
To account for population differences, we introduce the Anthropic AI Usage Index (AUI): values above 1 indicate per-capita Claude usage exceeds expectations based on working-age population.
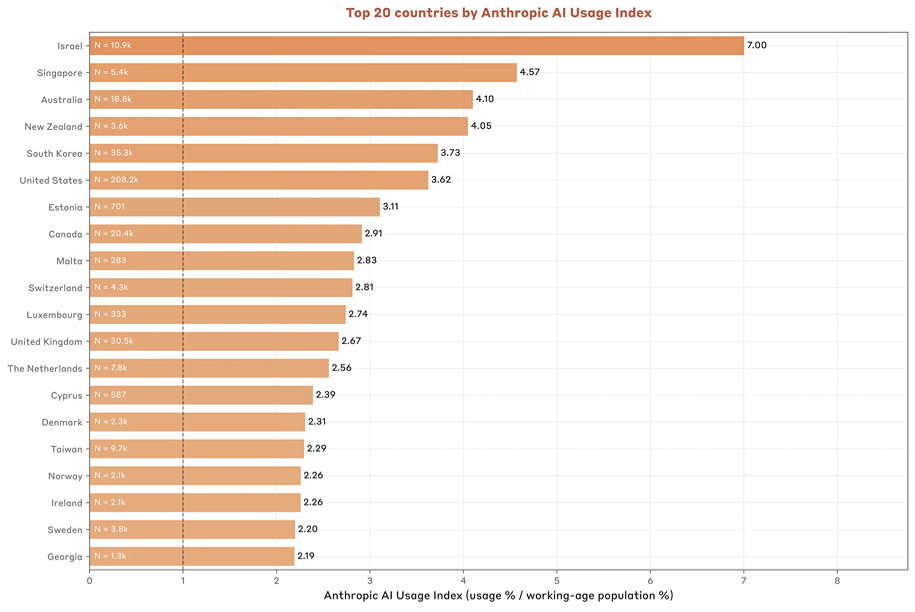
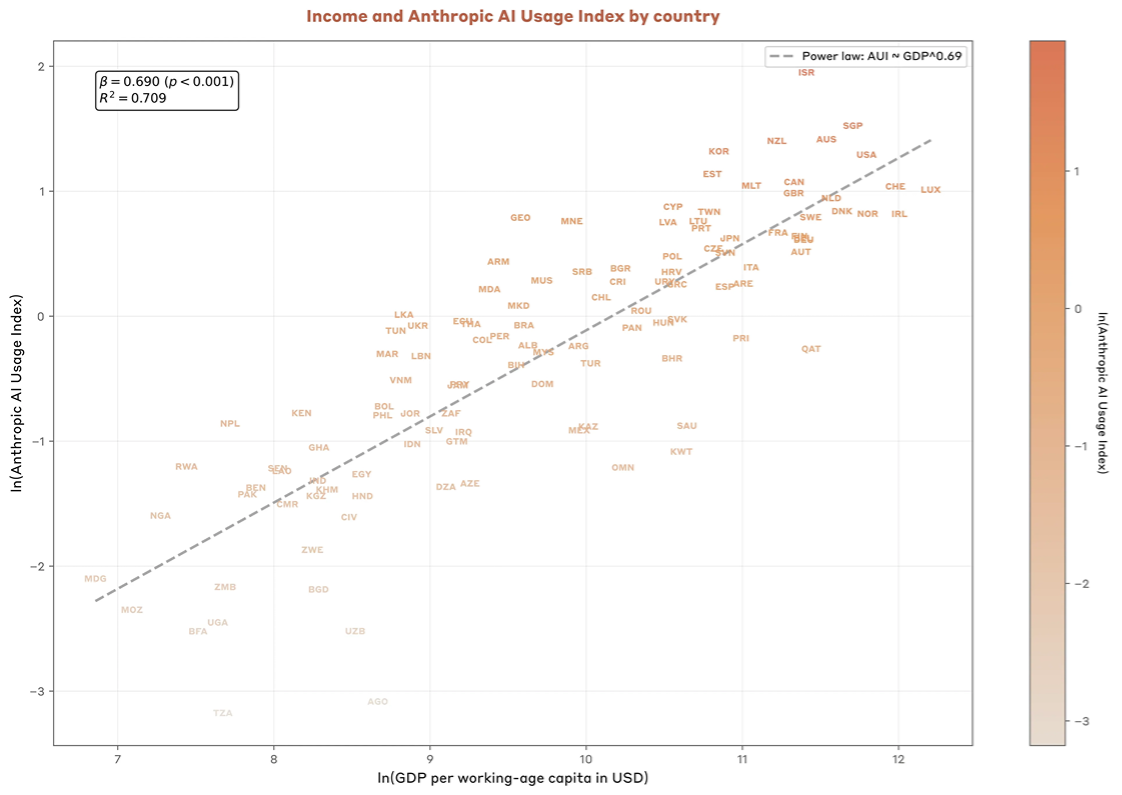
Data show that technologically advanced smaller economies (e.g., Israel, Singapore) punch above their weight in Claude adoption relative to their workforce size. GDP per capita is a key factor: a 1% rise in per-capita GDP corresponds to a 0.7% rise in AUI. This makes sense—high-usage countries tend to have strong internet infrastructure and knowledge-driven economies. But it also raises concerns about economic inequality: history shows that general-purpose technologies like electrification and the internal combustion engine boosted growth but also widened global living standard gaps. If AI benefits concentrate in high-income countries, a similar divergence may occur.
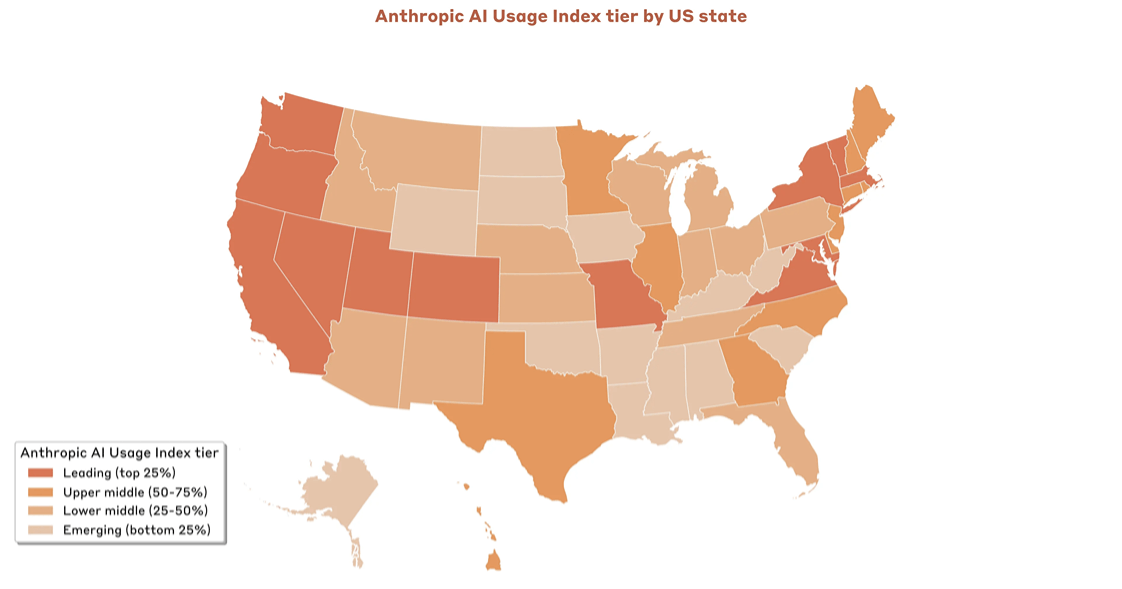
U.S. state-level patterns
The positive correlation between GDP per capita and Claude usage also holds at the state level, and is even stronger (a 1% increase in per-capita GDP corresponds to a 1.8% increase in per-capita usage). However, income alone does not explain all variation—economic structure matters.
-
The highest AUI is in Washington, D.C. (3.82), where Claude is most frequently used for document editing, information retrieval, and other knowledge work aligned with the city’s economy.
-
In California (ranked third in AUI), Claude is most often used for coding tasks.
-
Even in lower-usage states like Hawaii, tourism-related tasks occur at twice the national average.
Trends in Claude Usage
Since December 2024, we have tracked Claude usage through a privacy-preserving classification approach that maps anonymized conversations to task groups defined by O*NET (the U.S. government’s job-task taxonomy). This allows us to observe shifts in how people assign tasks to Claude and how they choose to collaborate with AI.
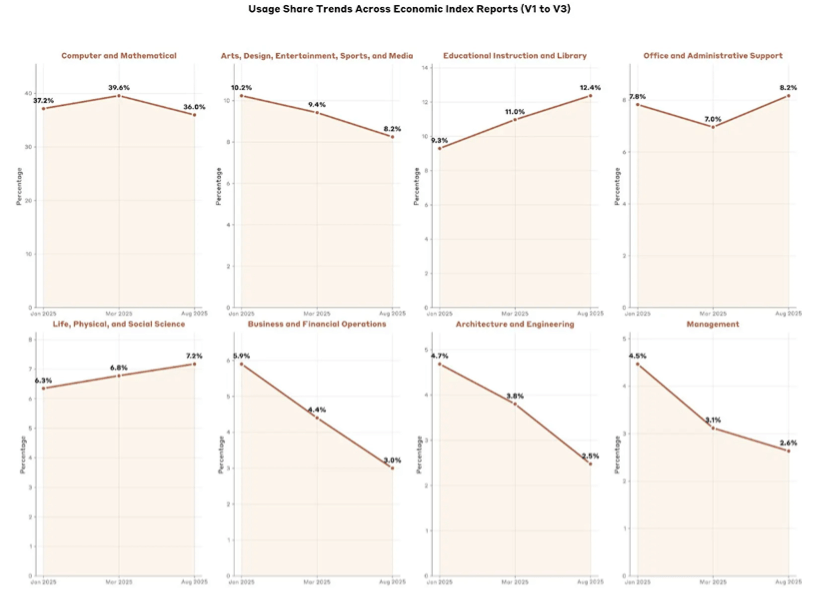
Task types
-
Computer science and mathematics tasks have consistently dominated since Dec 2024, representing about 37–40% of conversations.
-
But knowledge-intensive fields are rising quickly:
-
Educational guidance tasks grew by over 40% (from 9% to 13%).
-
Science-related tasks (physical and social sciences) grew by one-third (from 6% to 8%).
-
-
Business-oriented tasks declined in relative share:
-
Management tasks fell from 5% to 3%.
-
Business and finance operations dropped by half (6% to 3%).
-
Note: absolute volumes increased across all categories, even as shares shifted.
-
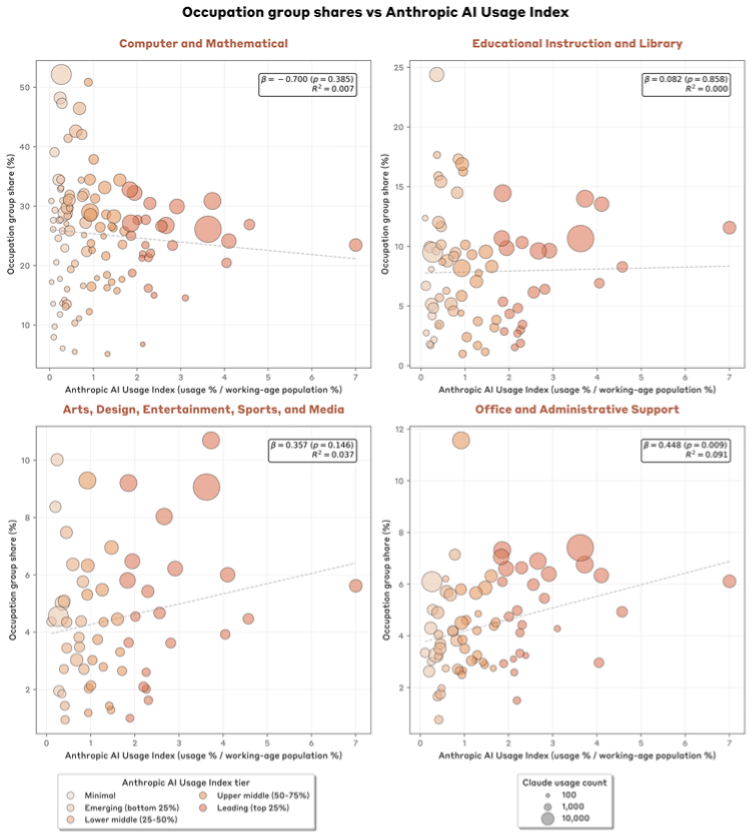
Overall, as GDP per capita rises, Claude usage tends to diversify from programming/math toward education, design, administration, and research. While software engineering remains the most frequent use case globally (and across U.S. states), richer contexts show broader application patterns.
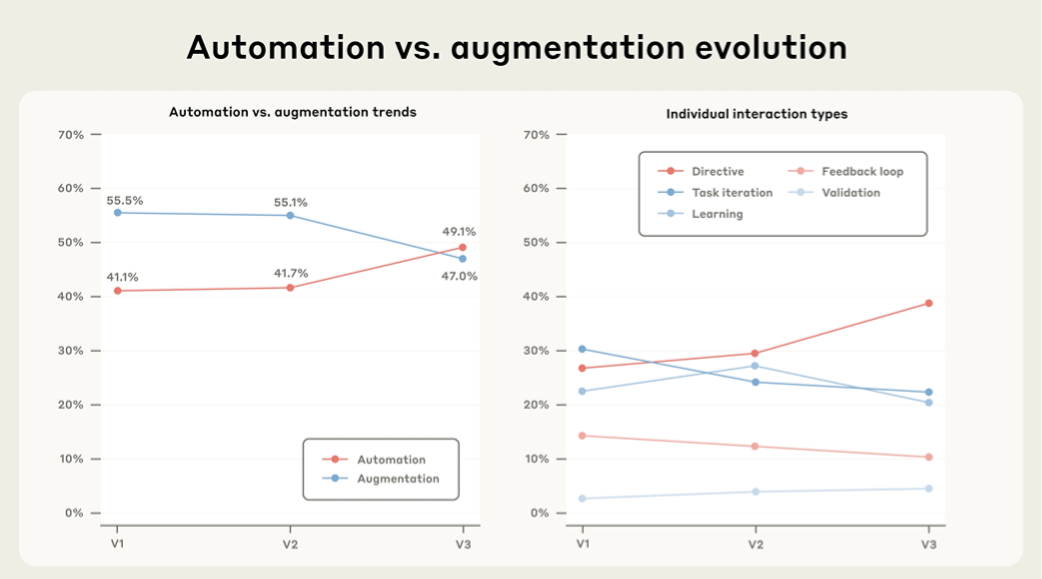
Interaction modes
We classify AI usage into:
-
Automation: minimal human oversight, AI outputs results.
-
Instructional dialogues: one-shot commands with minimal back-and-forth.
-
Feedback loops: humans provide real-world outcomes back to the model.
-
-
Augmentation: human-AI collaboration.
-
Learning: information retrieval, explanations.
-
Task iteration: step-by-step collaboration.
-
Validation: feedback requests.
-
From Dec 2024 to Mar 2025, instructional dialogues surged from 27% to 39%. As a result, automation (49.1%) overtook augmentation (47%) for the first time. This suggests users are increasingly trusting AI to handle tasks independently.
Model improvements likely contributed—for instance, when we began collecting Economic Index data in Dec 2024, the latest Claude version was Sonnet 3.6. As models became better at anticipating needs and producing high-quality results, users grew more confident in relying on first-pass outputs.
Interestingly, high-usage countries prefer augmentation, while lower-usage countries rely more on automation. Controlling for task type, each 1% rise in per-capita usage is associated with a 3% decline in automation share. This may reflect cultural differences among early adopters or broader economic factors.
Enterprise Applications
Using the same privacy-preserving methods as Claude.ai analysis, we sampled interactions from Anthropic’s first-party API customers. These clients—typically enterprises and developers—use Claude differently than consumers.
-
Task mix:
-
44% of API traffic maps to computer/math tasks (vs. 36% on Claude.ai).
-
~5% of API traffic is dedicated to developing or evaluating AI systems.
-
Educational (4% vs. 12%) and arts/entertainment (5% vs. 8%) tasks are underrepresented relative to Claude.ai.
-
-
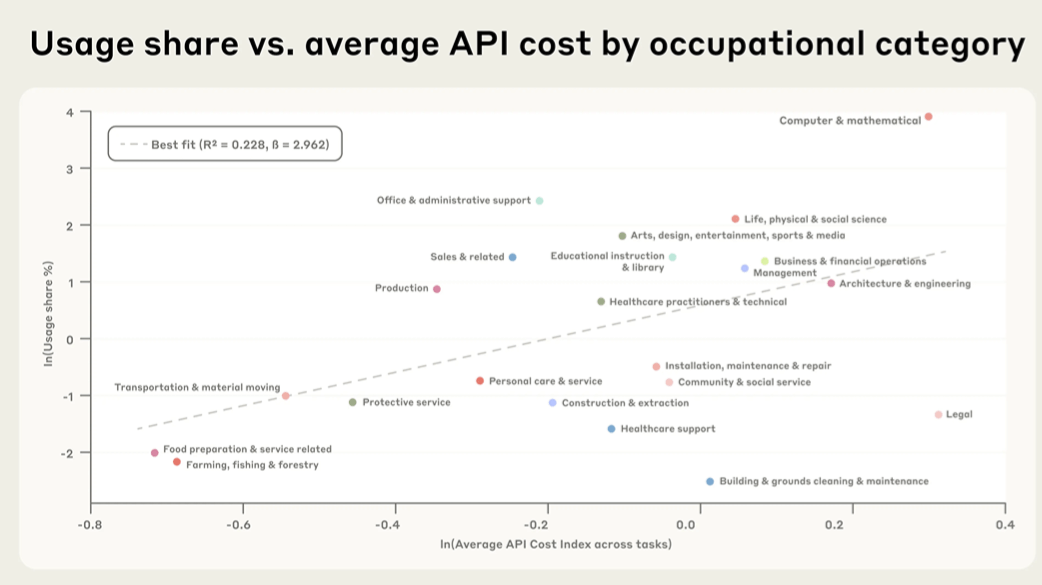
Task costs:
We examined whether task costs (measured by tokens consumed) affect enterprise adoption. Surprisingly, costlier task categories tend to be used more frequently. This suggests that enterprises prioritize functionality and economic value over token costs when deciding how to leverage Claude.
Conclusion
The Economic Index provides an empirical lens into AI’s early impacts on work and the economy. We find:
-
Adoption is highly uneven—high-income countries and states show higher usage, more collaboration, and broader task diversity.
-
Within the U.S., usage patterns reflect local industry structures (from tech to tourism).
-
Enterprises are more likely than consumers to delegate fully automated tasks to Claude.
Most notably, the share of instruction-based automation has risen sharply over the past nine months, showing that users are increasingly comfortable entrusting AI with independent responsibility. Humanity is still negotiating boundaries of collaboration and accountability with AI, but the trend suggests growing adaptation to AI agents in work.
We will continue tracking these dynamics as models improve, and as user trust and collaboration patterns evolve.
Interactive Data & Open Access
Explore the interactive dashboards on the Anthropic Economic Index site, covering country-, state-, and occupation-level usage:
-
Report website: https://www.anthropic.com/research/economic-index-geography
-
Interactive site: https://www.anthropic.com/economic-index
As always, we are releasing the full dataset, including geographic data, task-level patterns, automation vs. augmentation splits, and API usage summaries, for public access and research.
© Copyright Notice
The copyright of the article belongs to the author. Please do not reprint without permission.
Related Posts


No comments yet...