
Data Formulator: Reinventing Data Visualization with AI Power
What is Data Formulator?
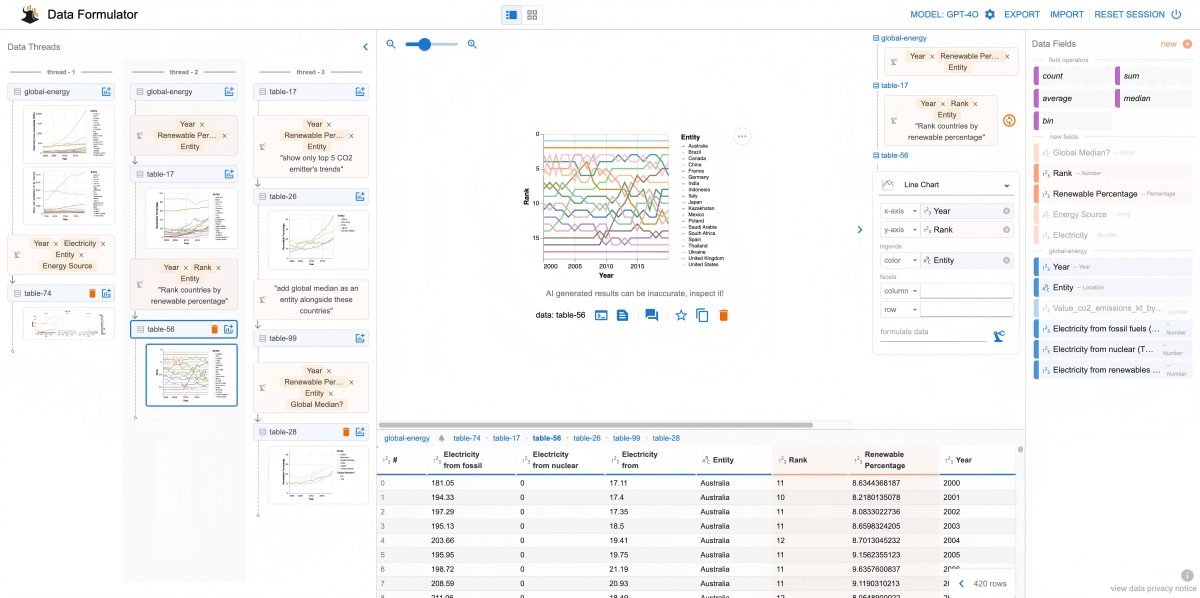
Data Formulator is an open-source AI-powered visualization tool developed by Microsoft Research. It simplifies the process of data transformation and chart creation for analysts and developers by combining natural language interaction with an intuitive graphical user interface (GUI). Users express their visualization intent naturally—either through text or UI actions—and the AI handles the underlying data manipulation and chart generation.
Key Features
-
Natural Language + GUI Integration: Users can describe what they want using plain language or drag-and-drop operations. The AI interprets this and generates the required data transformations and visualizations.
-
Multi-Table Support: The latest version allows users to work with multiple tables, enabling automatic joins and merges for more complex analyses.
-
Iterative Visualization Creation: A built-in “data thread” records each step of the user’s process, making it easy to revisit, revise, and refine charts.
-
Transparent AI Process: The tool displays the AI-generated code and transformed datasets, empowering users to review and edit them for full control and accuracy.
Technical Architecture
Data Formulator’s architecture consists of the following components:
-
Concept Encoding Interface: Users define new data concepts or select existing fields, specifying how data maps to visual encodings.
-
Vega-Lite Chart Generator: Based on user input, the tool produces visualizations using the Vega-Lite specification.
-
AI-Powered Transformation Engine: Large Language Models (LLMs) generate Python code to transform data according to user intent expressed in natural language.
-
Chart Renderer: Combines the transformed data with chart configurations to render final visualizations.
This architecture separates high-level visualization intent from the lower-level data manipulation logic, making complex visual analysis accessible to users without deep technical backgrounds.
Project Information & Installation
-
GitHub Repository: https://github.com/microsoft/data-formulator
Installation Options:
-
Via pip:
-
Using GitHub Codespaces:
The repository provides a pre-configured environment for instant launch and use. -
Local Development:
Follow instructions in theDEVELOPMENT.mdfile for building and running the tool locally.
Use Cases
-
Data Analysis and Visualization: Ideal for analysts and researchers who need to rapidly generate and iterate on visual insights.
-
Education and Teaching: A valuable tool for helping students learn data visualization principles and techniques.
-
Business Intelligence: Enables teams to quickly create charts and dashboards for decision-making.
-
Research and Publishing: Supports high-quality chart creation for use in academic papers and professional reports.
© Copyright Notice
The copyright of the article belongs to the author. Please do not reprint without permission.
Related Posts


No comments yet...