Preswald: The Powerful Python Tool to Build Interactive Data Apps
What is Preswald?
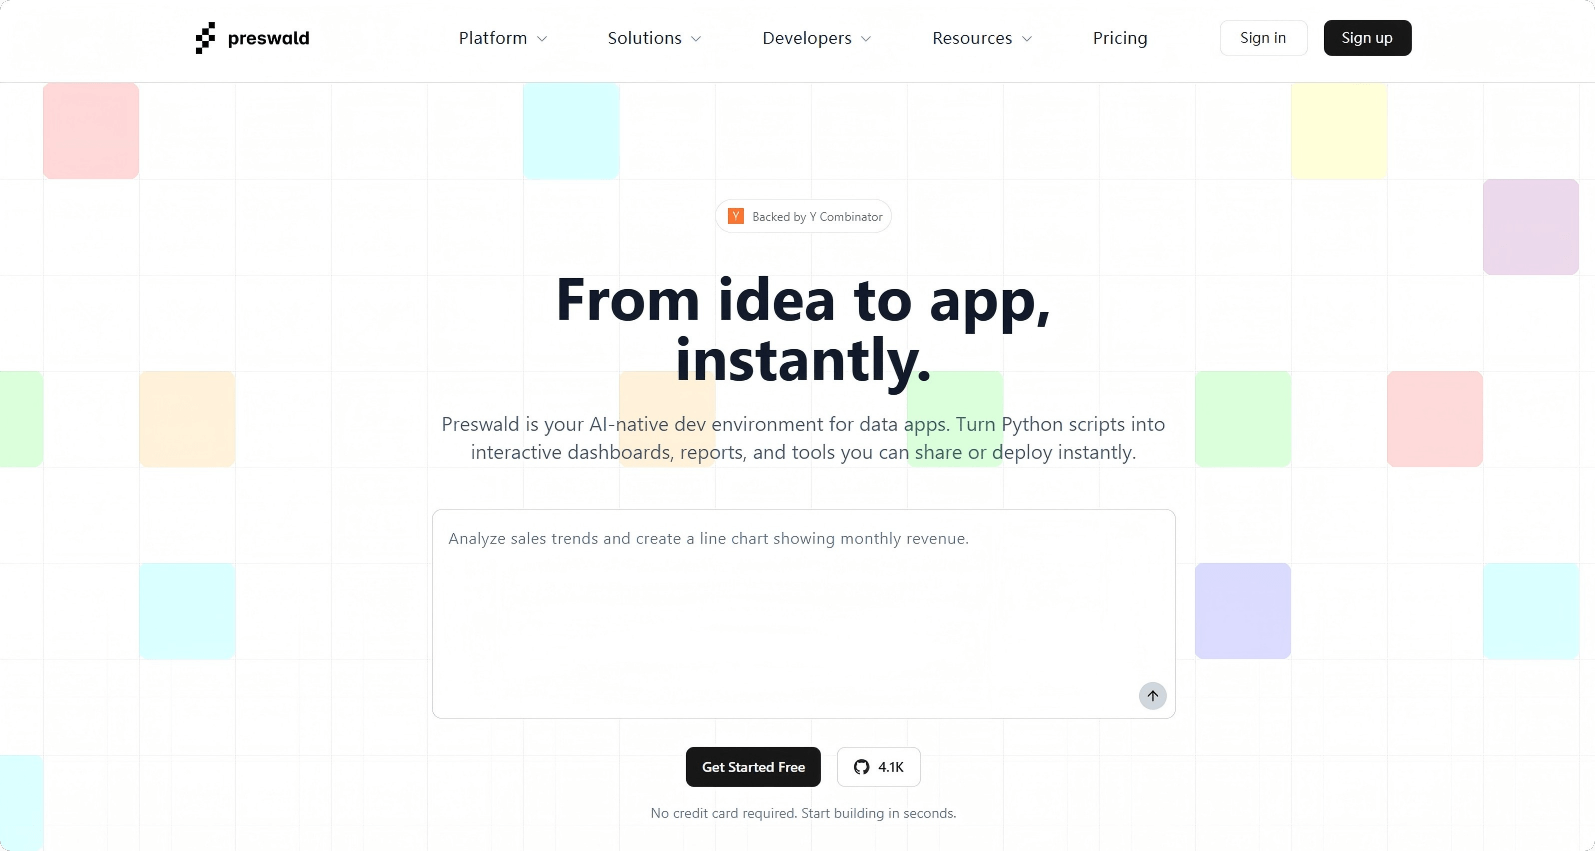
Preswald is an AI-native data app development environment designed to turn Python scripts into interactive browser-based applications. It packages computation, data access, and user interfaces into self-contained apps that run offline in the browser. It’s perfect for quickly building data dashboards, reports, and internal tools.
Key Features
1. Python-Driven Development
Write your app logic entirely in Python without needing to write HTML or JavaScript, lowering the development barrier and speeding up the workflow.
2. One-Click Static App Export
Use the preswald export command to bundle your Python script, data, and UI into a single static .html file that runs offline, making sharing and deployment easy.
3. Built-in UI Components
Includes tables, charts, forms, sliders, and more, with responsive layouts and automatic dependency tracking for efficient UI updates.
4. Browser-Side Computation Engine
Powered by Pyodide and DuckDB WebAssembly (WASM) runtime, it executes Python code and SQL queries directly in the browser, enabling fast data processing and analysis.
5. Offline Support & High Performance
No server required—runs entirely in modern browsers offline, handling large datasets smoothly.
6. AI-Friendly Architecture
Clear app structure supports AI Agent integration and automation for intelligent data analysis and decision-making.
Technical Overview
-
Pyodide: CPython compiled to WebAssembly enabling Python to run in browsers.
-
DuckDB: Embedded high-performance SQL database for data analysis.
-
WebAssembly (WASM): Browser runtime technology allowing high-performance computations on the client side.
-
DAG Dependency Tracking: Directed Acyclic Graph tracks variable and component dependencies, recalculating only affected parts for efficiency.
Project Links and Resources
-
Official Site & Demos: https://preswald.com/home
-
GitHub Repository: https://github.com/StructuredLabs/preswald
Typical Use Cases
1.Data Analytics Dashboards
Build interactive dashboards with filtering and visualization for business insights and decision support.
2.Dynamic Report Generation
Transform static reports into dynamic apps that update based on user input, increasing usability and engagement.
3.Data Exploration and Validation Tools
Create data exploration and quality validation tools for data inspection and cleansing.
4.Offline Data Applications
Develop offline-capable data apps ideal for fieldwork, data collection, or environments with limited connectivity.
5.Internal Tools and Prototyping
Rapidly build internal utilities and prototypes for quick iteration and validation, accelerating development cycles.
© Copyright Notice
The copyright of the article belongs to the author. Please do not reprint without permission.
Related Posts


No comments yet...