
ChartAI – An AI data analysis tool that automatically recommends and generates charts suitable for the data.
What is ChartAI?
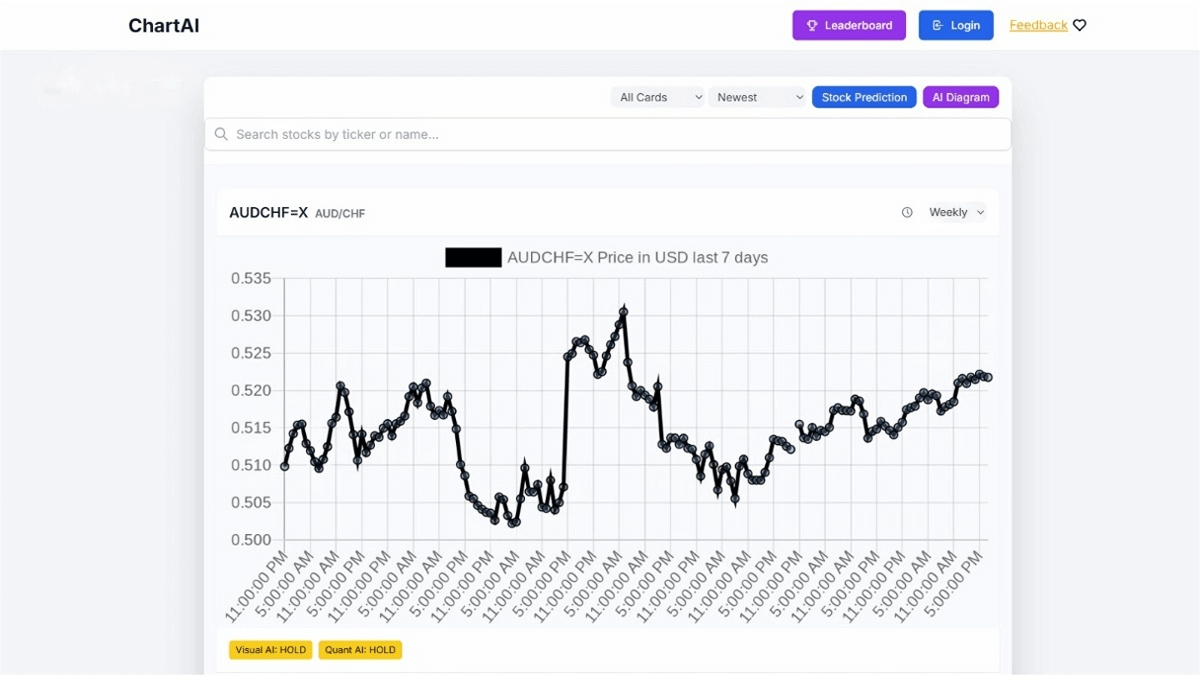
ChartAI is an AI-powered data analysis and visualization tool that enables users to quickly transform complex data into intuitive charts and visual reports, helping them easily understand data trends and gain insights. Users can input data or provide links, and ChartAI will generate personalized charts based on intelligent algorithms, supporting a variety of chart types. With its simple and user-friendly interface, ChartAI is suitable for users ranging from beginners to professionals. It is widely applied in fields such as business analysis, market research, and data reporting, empowering efficient decision-making and data-driven business development.
The main functions of ChartAI
- Data import: Supports quick import of multiple formats (such as Excel, CSV) and data sources.
- Intelligent Chart Generation: Automatically recommends and generates suitable chart types for the data, such as bar charts, line charts, pie charts, etc.
- Personalized Customization: Users can customize chart styles, colors, fonts, etc., to meet personalized needs.
- Interactive Analysis: Supports operations such as zooming, filtering, and hovering to help users deeply explore the data.
- Insights and Prediction: Uses AI technology to analyze data and provide trend predictions and key insights.
- Report Sharing: Exports charts in multiple formats (such as PDF, PNG) and supports online sharing.
- Multi-platform Access: Supports access on both desktop and mobile devices, making it convenient to view and edit charts anytime, anywhere.
The official website address of ChartAI
- Official website: chartai.io
Application scenarios of ChartAI
- Business Analysis: Quickly convert sales, marketing and other data into charts to assist management in making decisions.
- Financial Visualization: Generate charts of financial statements to clearly display the financial situation.
- Market Research: Present consumer preferences and market trends to provide a basis for strategy formulation.
- Project Management: Monitor project progress and promptly identify and solve problems through charts.
- Education and Training: Visualize students’ grades or training data to facilitate teaching and understanding.
© Copyright Notice
The copyright of the article belongs to the author. Please do not reprint without permission.
Related Posts


No comments yet...